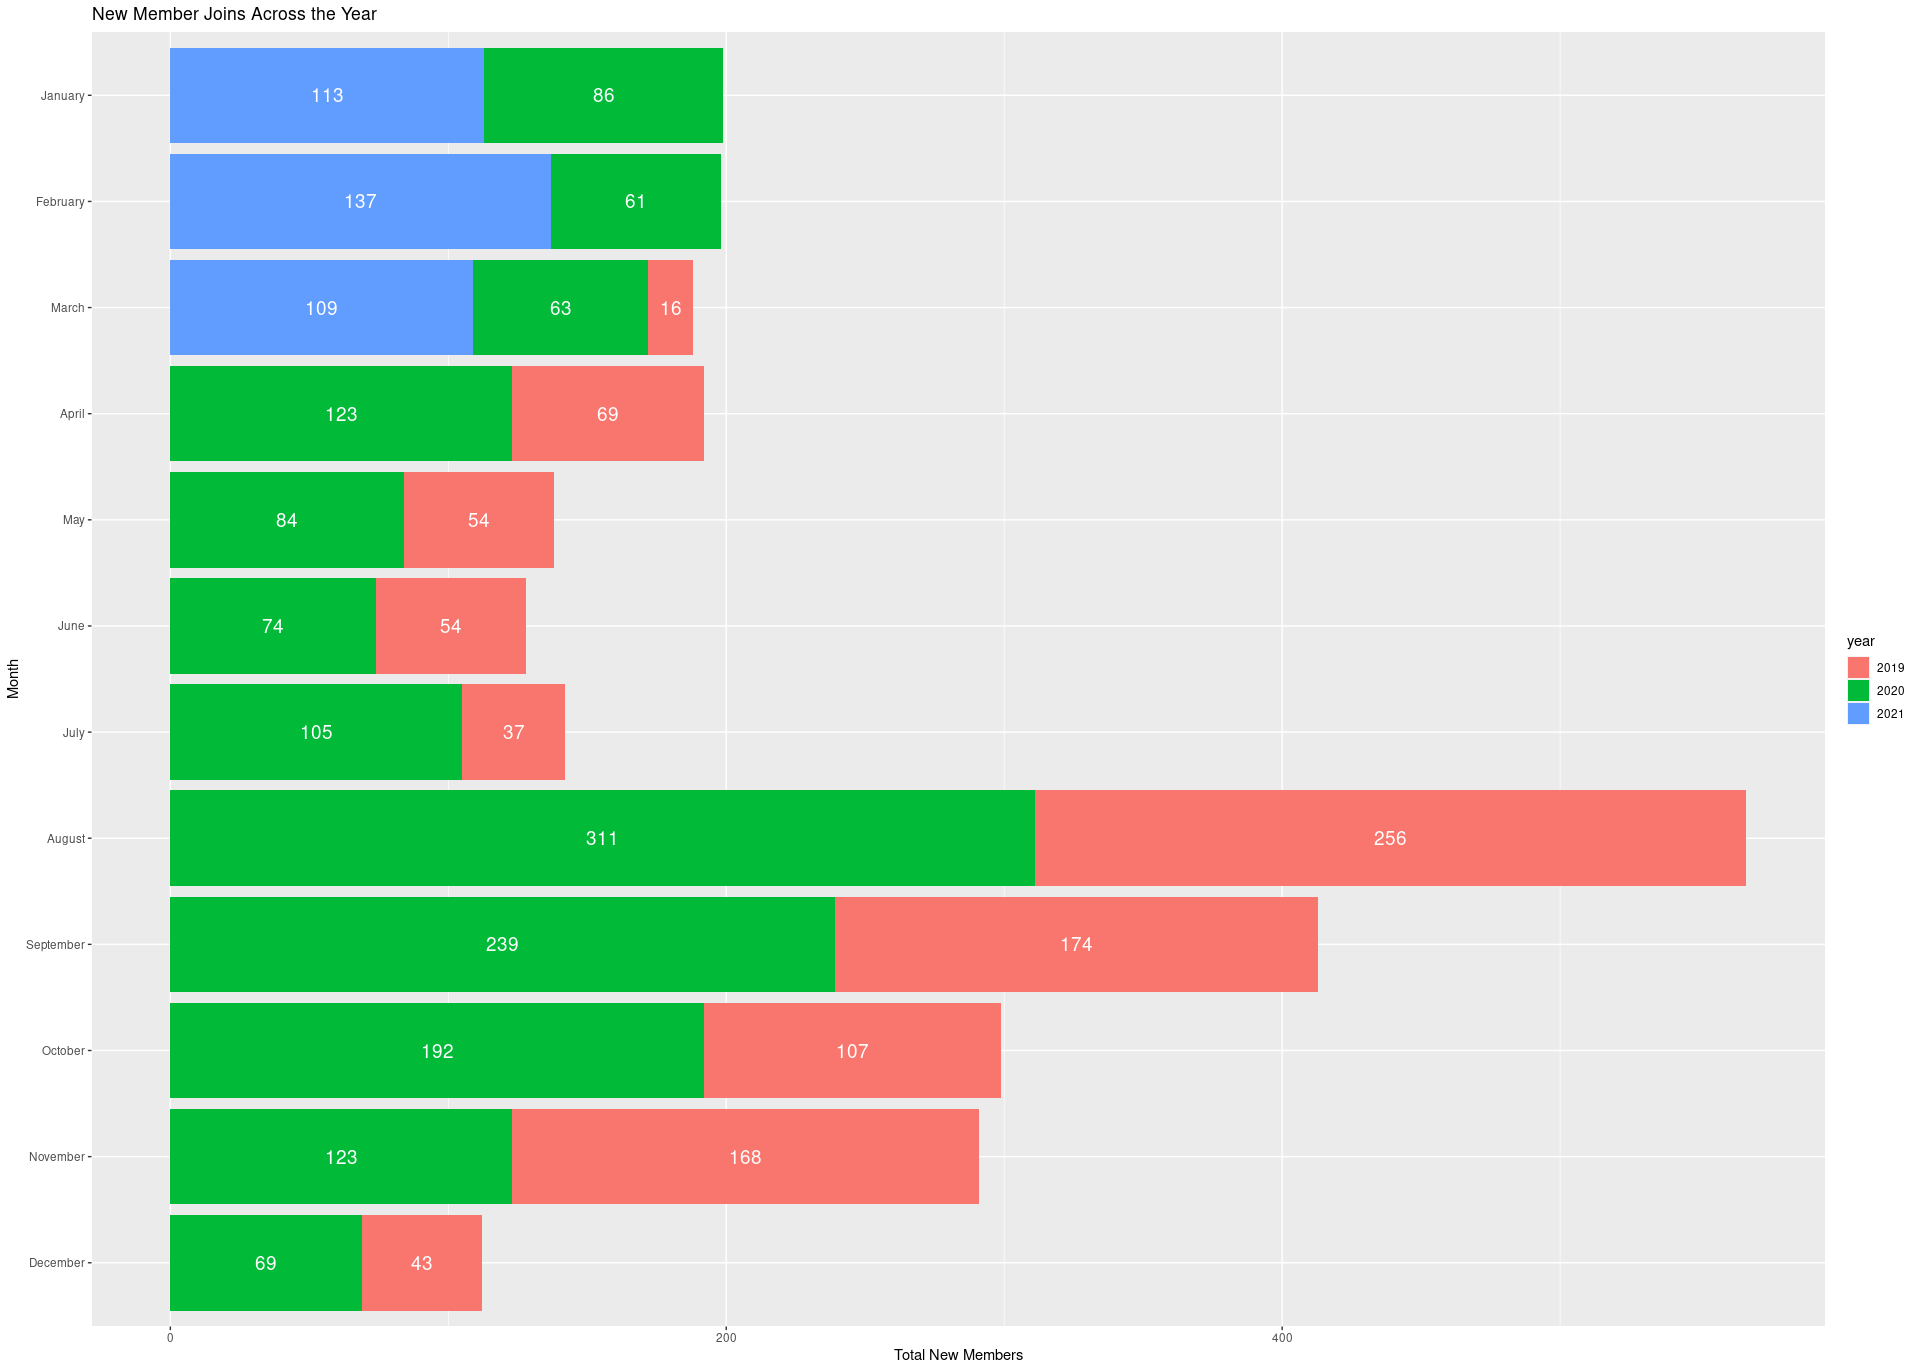
Behind The Scenes of Illini Esports Growth and Engagement Analysis
Analysis
This post is my documentation on the code I wrote to generate the graphs and figures from my Illini Esports Growth and Engagement Analysis Post. I have also posted the report to my github repository Feel free to read the original document as it contains the full written analysis and insights from my team. I gained a lot of experience working with date time objects and ggplot2 in this project.
Nvidia Acquiring ARM From The Perspective of a Technology Enthusiast and Business Student
Analysis
As reported by the Nvidia blog, ARM is being acquired by Nvidia. There were rumors in July. After reading the official confirmation, I decided to make a blog post so that I could share my thoughts without reposting it about why Nvidia acquired ARM. I do enjoy reading and listening to analysis of the technology industry and businesses.

How to Setup Favicons For Jekyll Blogs Generated by Fastpages
Blog
While setting this up blog, I had issues changing the favicons for my website. I tried a web search of jekyll blog how to change favicon for guides on how to change the favicons for pages hosted through github pages. Of the guides from the search, many recommended using a RealFaviconGenerator.
Using Matplotlib to Animate Data From a Velocity Recording
Analysis
Visualization
Verifying a 3 Meter Walk
Analysis
In my research with the Neuroscience of Dance in Health and Disability Laboratory, I was tasked with verifying that the recorded section of motion capture data of the participant had truely traveled 3 meters. We chose 3 meters as it is the best sampled portion of the walk for analysis and was consistent with past studies. I wrote this in hopes that this would be used in future studies so that a researcher would not need to calculate by hand when verifying and picking a section of the recording.
No matching items